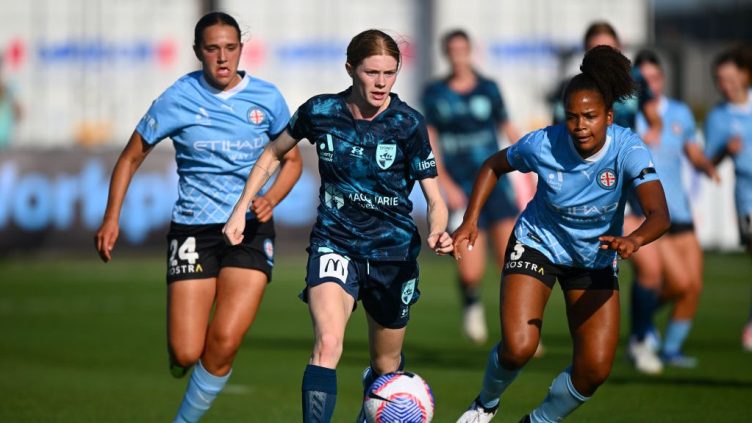

Ahead of this weekend’s Liberty A-League Grand Final between Melbourne City and Sydney FC, Opta data identifies where the title decider could be won or lost, with City’s ‘creative force’ pitted against the league’s top provider in a pivotal battle in the Championship fight.
The Liberty A-League Grand Final is almost upon us.
After a long campaign, Melbourne City and Sydney FC will face off this weekend with the title on the line.
It is fitting that the two best teams through the regular season are the sides that will ultimately battle it out for the top prize. City clinched the Premiers Plate – their third such crown and their first since 2019-20 – with 41 points from their 22 games.
Sydney, the three-time reigning Premiers and the defending Champions, finished second, two points behind them.
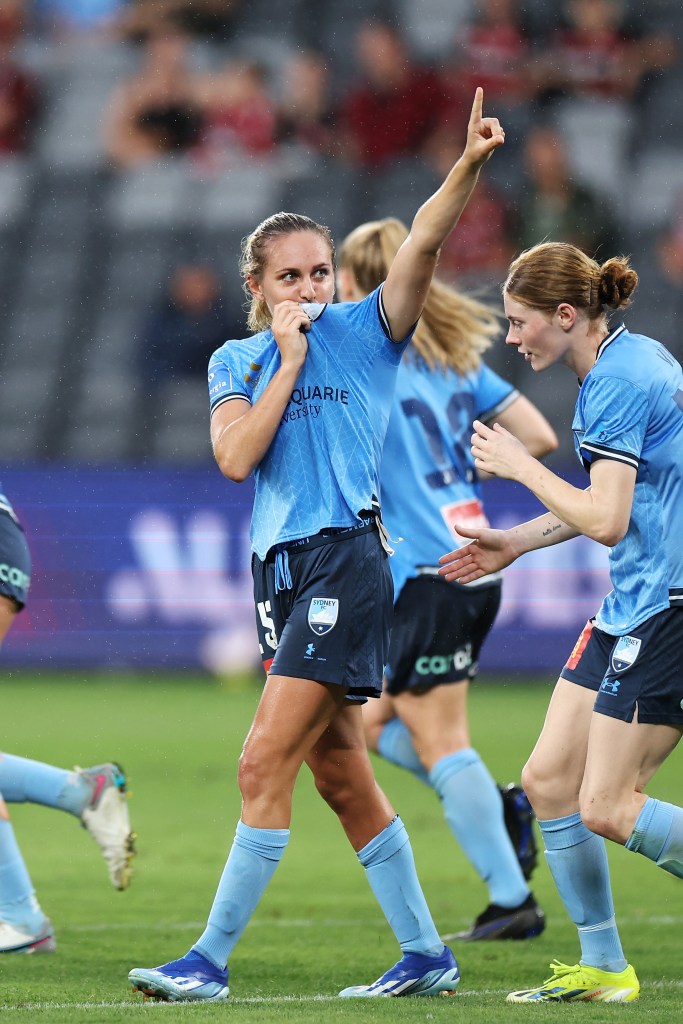
While City swatted aside Newcastle Jets 6-0 on aggregate in the Semi-Finals, Sydney overcame Central Coast Mariners 2-1 to book their place in the Grand Final.
Here, we use Opta data to look at how each of these sides have played this term, delving into their key metrics and standout performers.
GRAND FINAL GUIDE: Everything you need to know
GET YOUR TICKETS TO THE GRAND FINAL TODAY!
The Standout Performers
Daniela Galic, with seven goals and six assists, is the only City player to have logged five or more goals and five or more assists this term, while Hannah Wilkinson is their leading scorer with 10 goals from 22 appearances – those strikes have come from an xG figure of 14.62, however, so she has perhaps not been as clinical as she would have liked.
Galic, on the other hand, has exceeded her 4.88 xG, which is something Emina Ekic, with eight goals from 5.39 xG, has also managed.
Rhianna Pollicina has been City’s creative force, crafting 37 chances for her teammates while providing four assists.
Rebekah Stott, meanwhile, has played more passes (1,695), made more interceptions (52), clearances (72), and had more carries (440) and made more metres from carries (4,635) than any of her clubmates.
Cortnee Vine has been Sydney’s main driver, having been directly involved in 16 goals (10 goals, six assists), double the tally of any other player for the club this term.
Mackenzie Hawkesby has created 72 chances, 22 more than any other player in the Liberty A-League, though she has produced just three assists (and only 3.72 expected assists).
Charlotte Mclean, meanwhile, tops the chart for interceptions, with 79, and has been crucial to Sydney’s out-of-possession play.
GET YOUR TICKETS TO THE GRAND FINAL TODAY!

The Underlying Metrics
City have scored 46 goals this campaign, which is 13 more than Sydney’s tally, despite the latter having had 48 shots more than their upcoming opponents (400 to 352).
That shot conversion rate of 13% is five percentage points higher than Sydney’s – City’s finishing has been much more clinical.
Their clinical nature is proven by a 43% big-chance conversion rate (30 from 70), which is again five percentage points higher than that recorded by Sydney (38% – 23/61).
Both teams have, however, underperformed their expected goals (xG) figures – City by 6.2 (46 goals from 52.2 xG) and Sydney by 6.7 (33 from 39.7 xG). Sydney are perhaps more about quantity over quality – they have made 803 penalty area entries this season, 121 more than City (682).
GET YOUR TICKETS TO THE GRAND FINAL TODAY!
These sides certainly have contrasting styles, showing there is more than one route to success.
While City have averaged 62% possession across the campaign, Sydney have averaged just 46%, which is the second-lowest figure in the competition. These contrasting tactics are also exemplified by their respective passing accuracies – City have been on target with 82% of their 12,467 passes, in comparison to 68% for Sydney from 8,731 passes.
It is perhaps no surprise then, to see a huge difference in the total number of 10+ pass sequences for each side – 202 for City (who average 3.19 passes per sequence) compared to just 36 for Sydney (who average 2.06 passes per sequence).
But how about their defending? As one would expect with Sydney having less of the ball, they have gone into more tackles, attempting 575 compared to City’s 372, but winning 71 % in contrast to City’s 75%.
Sydney’s less expansive style has also helped them keep it tighter at the back than the Premiers – they have recorded an xGA (expected goals against) figure of 24.6, in contrast to City’s 31.1.
A more direct approach from Sydney has also resulted in them forcing more high turnovers than City – 370 to 332.
From such situations, Sydney have had 68 shots, whereas City have had 42. That being said, Sydney (eight) have only scored two more goals from high turnovers than their Grand Final opponents (six).
The Formations
City have used nine different formations this season, but Dario Vidosic has generally favoured a 4-4-2, 4-3-3 or 4-2-3-1.
They are actually unbeaten while playing 4-2-3-1 this term, while they have lost just once while deployed in a 4-4-2.
Ante Juric, meanwhile, has switched between just four formations, but he has massively favoured a 4-3-3, which he employed in Sydney’s two previous league meetings with City this season, albeit they took just one point from the six on offer.
Interestingly, Sydney have not made a change to their starting XI from their previous game for six of their last 11 A-League matches.
Four of City’s five losses this season, meanwhile, came after Vidosic had made at least two alterations to his starting XI.
GET YOUR TICKETS TO THE GRAND FINAL TODAY!